Bifröst
Debugging the Hardware-Software Boundary
ACM Symposium on User Interface Software and Technology — UIST 2017
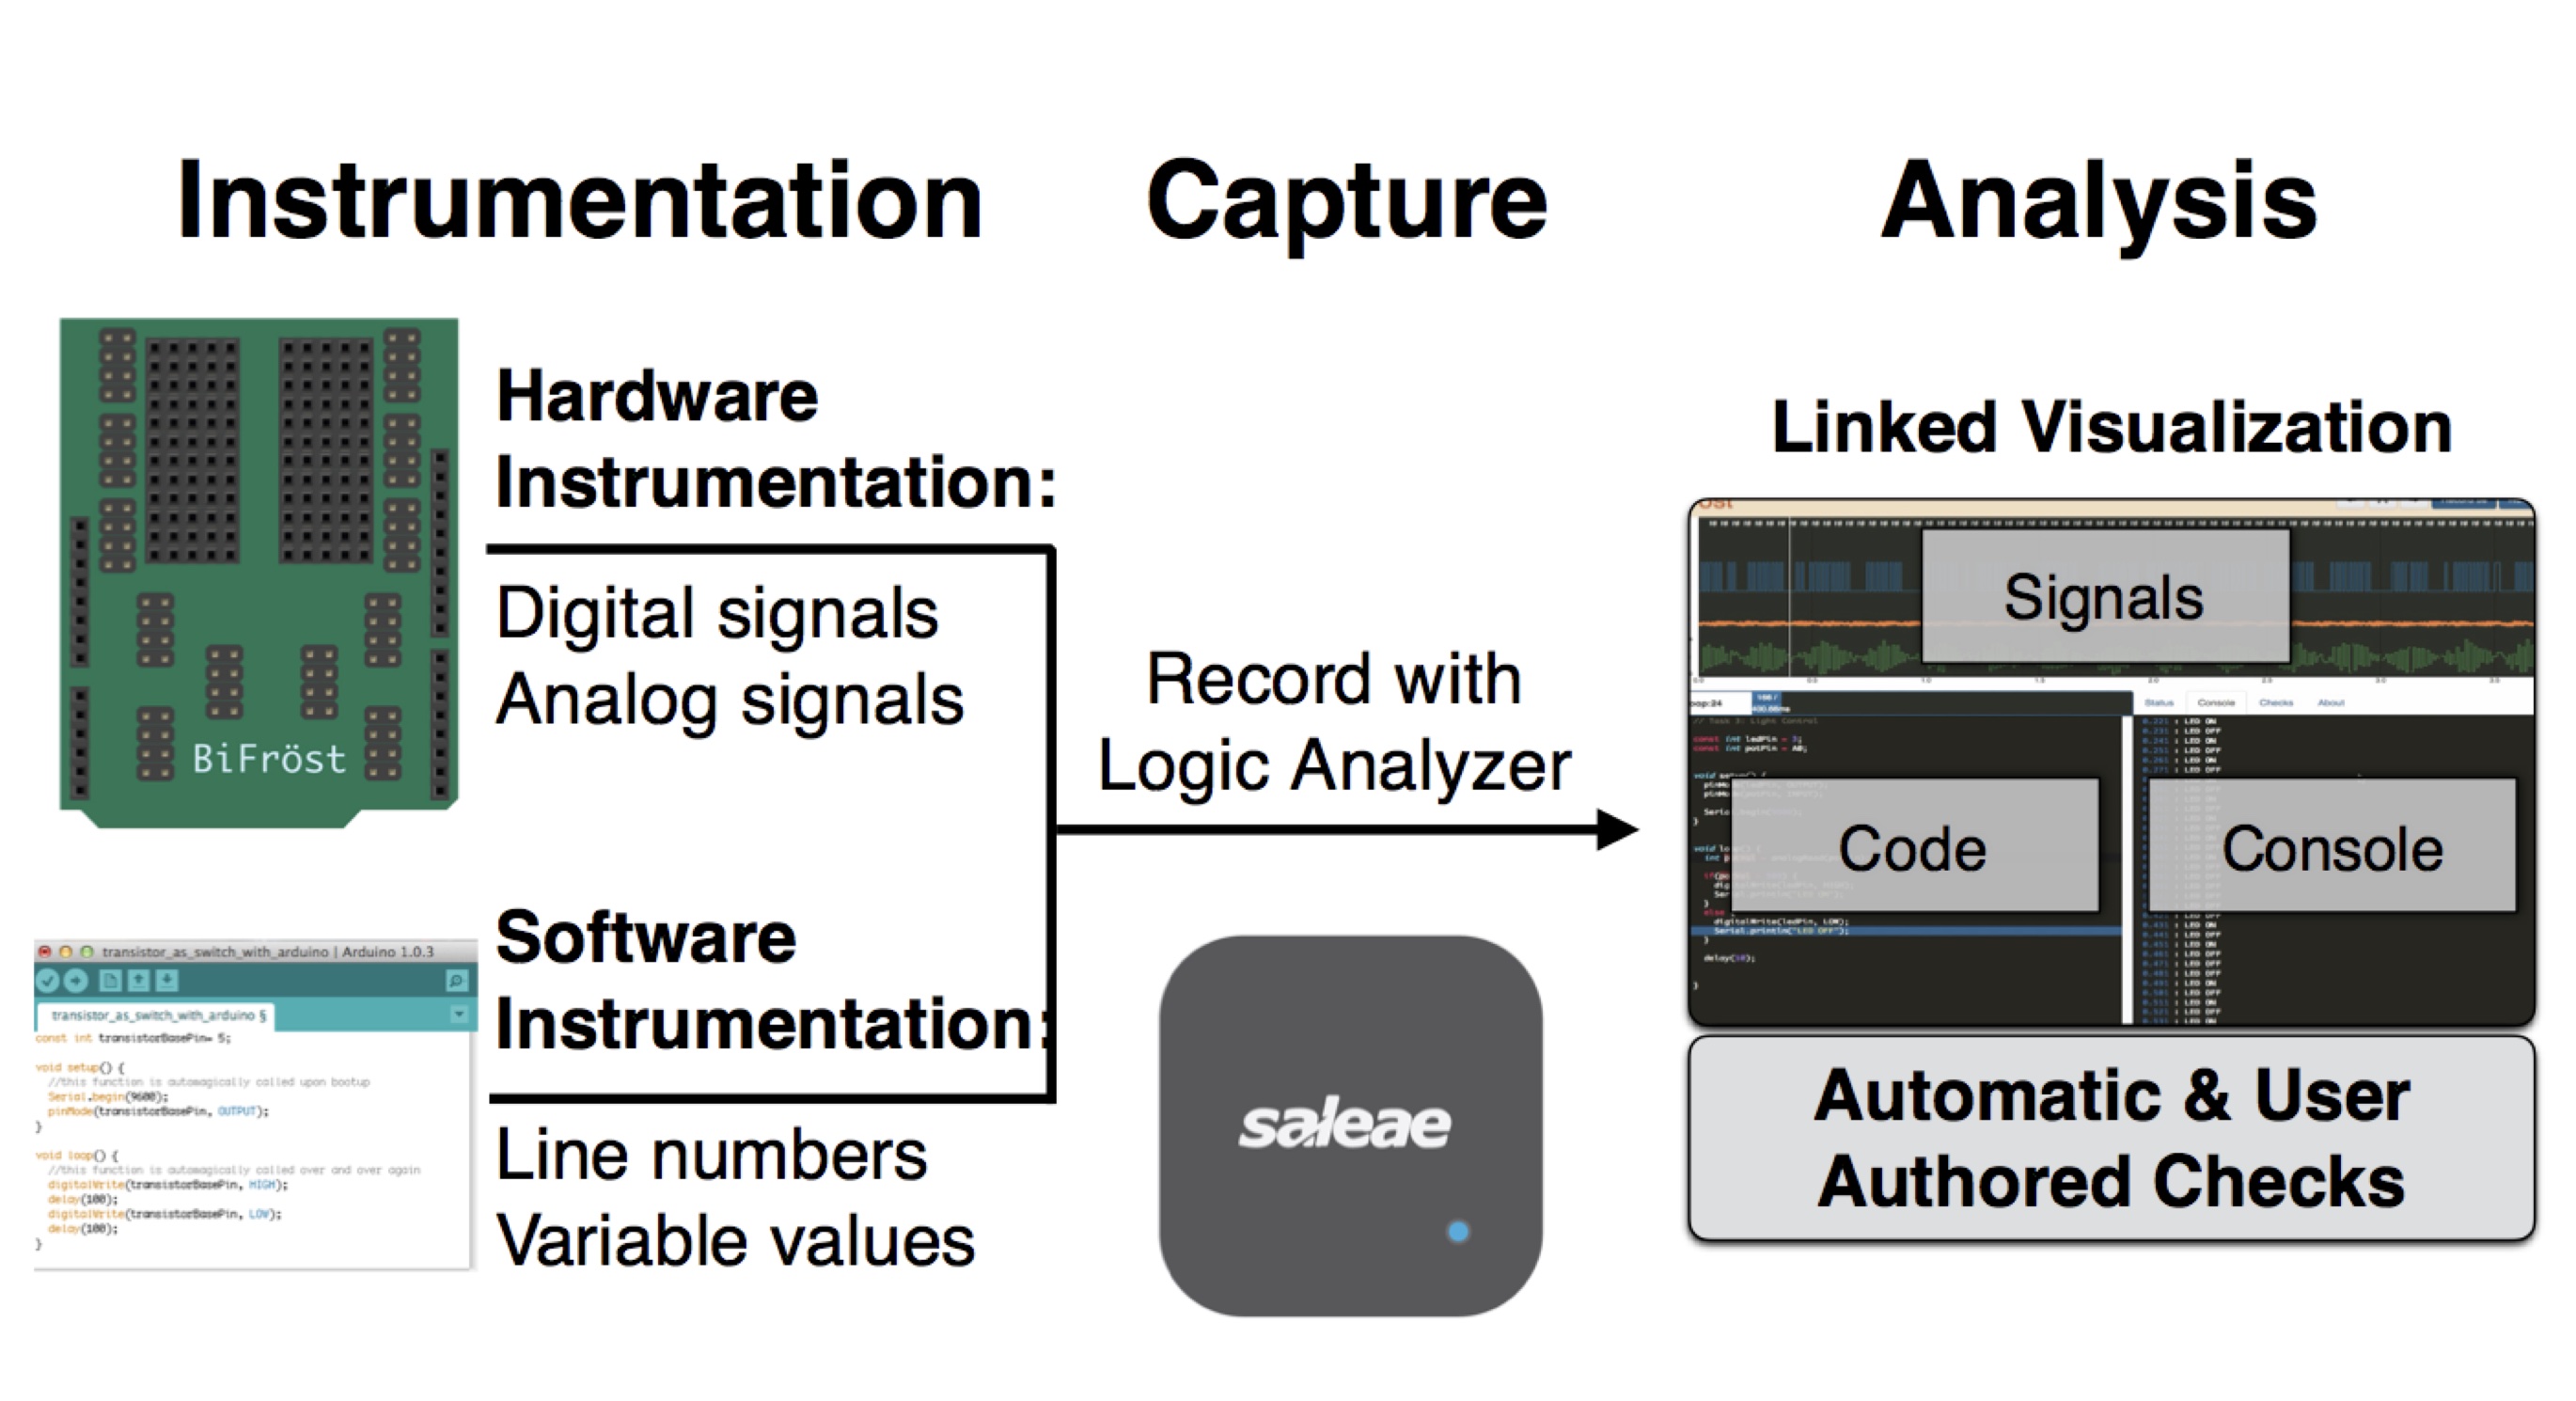
The Maker movement has encouraged more people to start working with electronics and embedded processors. A key challenge in developing and debugging custom embedded systems is understanding their behavior, particularly at the boundary between hardware and software. Existing tools such as step debuggers and logic analyzers only focus on software or hardware, respectively. This paper presents a new development environment designed to illuminate the boundary between embedded code and circuits. Bifröst automatically instruments and captures the progress of the user’s code, variable values, and the electrical and bus activity occurring at the interface between the processor and the circuit it operates in. This data is displayed in a linked visualization that allows navigation through time and program execution, enabling comparisons between variables in code and signals in circuits. Automatic checks can detect low-level hardware configuration and protocol issues, while user-authored checks can test particular application semantics. In an exploratory study with ten participants, we investigated how Bifröst influences debugging workflows.
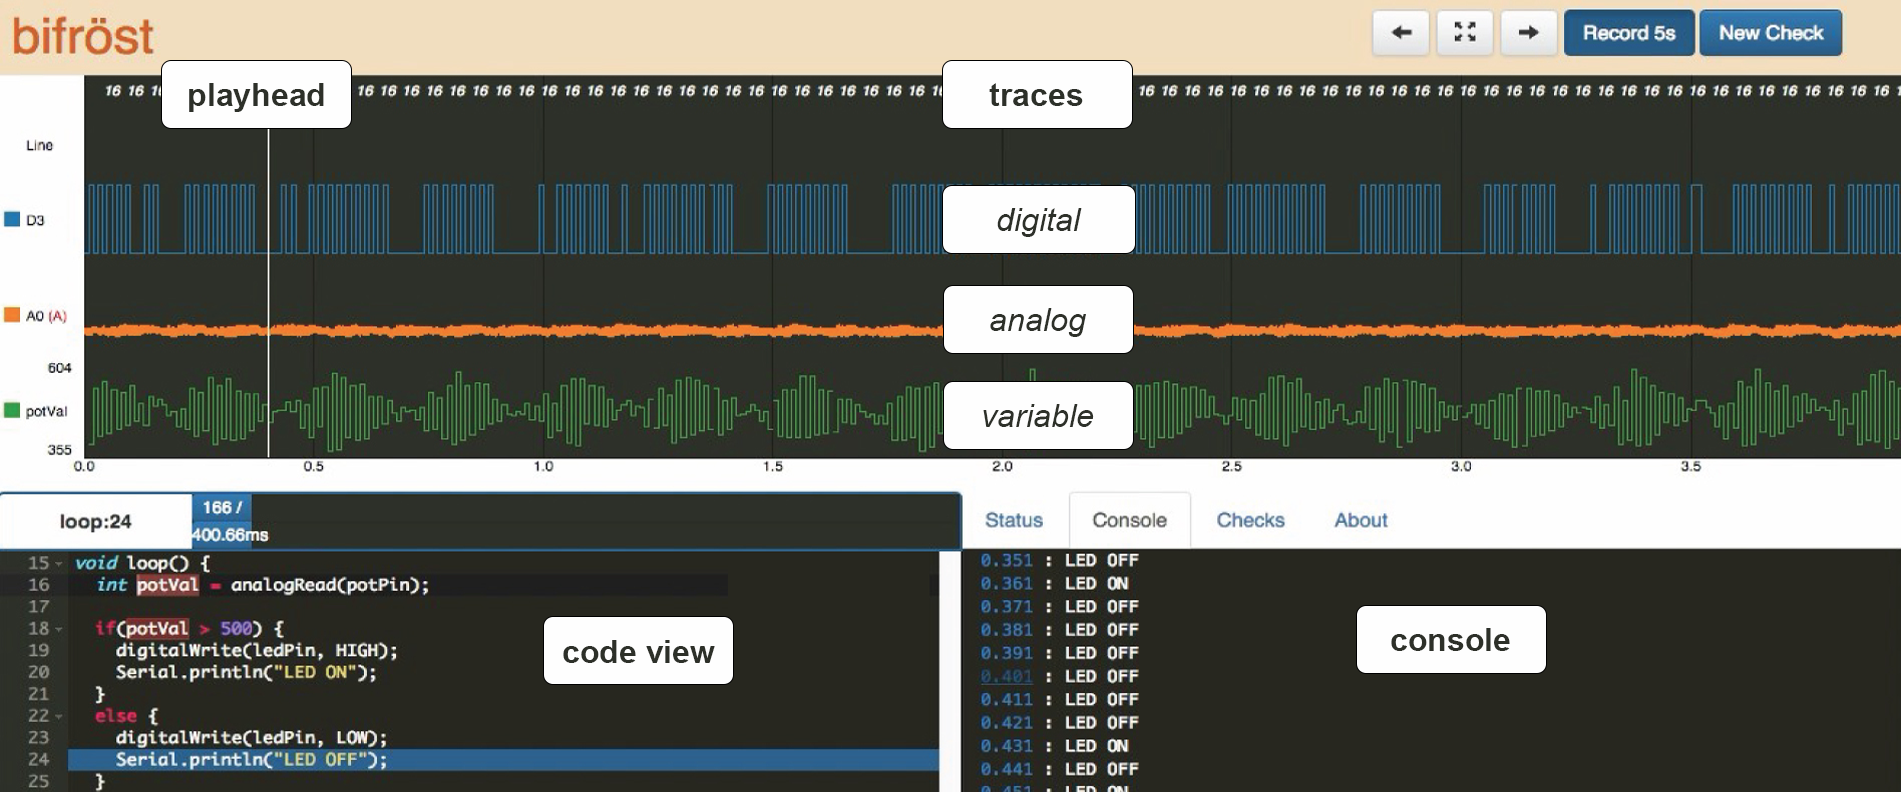
The trace view panel allows for digital signals, analog signals, and variable values to be visualized in the same location. The code view panel is a standard code editor with the added ability to use the line numbers to jump to the next point in the recorded runtime trace when that line was executed. It also allows for users to double click on any variable to include its values from the code alongside trace data. The serial console adds timestamps to each print statement and links them to their respective execution point in the trace view.